pygmt.Figure.plot
- Figure.plot(data=None, x=None, y=None, size=None, direction=None, *, straight_line=None, frame=None, cmap=None, offset=None, error_bar=None, connection=None, color=None, intensity=None, projection=None, close=None, no_clip=None, region=None, style=None, timestamp=None, verbose=None, pen=None, xshift=None, yshift=None, zvalue=None, aspatial=None, binary=None, panel=None, nodata=None, find=None, coltypes=None, gap=None, header=None, incols=None, label=None, perspective=None, transparency=None, wrap=None, **kwargs)
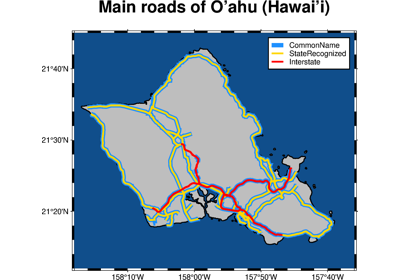
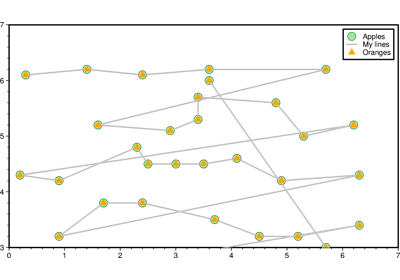
Plot lines, polygons, and symbols in 2-D.
Takes a matrix, (x,y) pairs, or a file name as input and plots lines, polygons, or symbols at those locations on a map.
Must provide either
dataorx/y.If providing data through
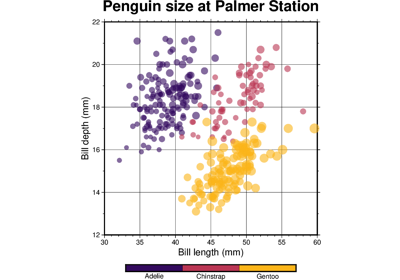
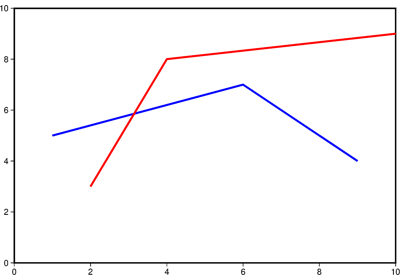
x/y,colorcan be a 1d array that will be mapped to a colormap.If a symbol is selected and no symbol size given, then plot will interpret the third column of the input data as symbol size. Symbols whose size is <= 0 are skipped. If no symbols are specified then the symbol code (see
stylebelow) must be present as last column in the input. Ifstyleis not used, a line connecting the data points will be drawn instead. To explicitly close polygons, useclose. Select a fill withcolor. Ifcoloris set,penwill control whether the polygon outline is drawn or not. If a symbol is selected,colorandpendetermines the fill and outline/no outline, respectively.Full parameter list at https://docs.generic-mapping-tools.org/latest/plot.html
Aliases:
A = straight_line
B = frame
C = cmap
D = offset
E = error_bar
F = connection
G = color
I = intensity
J = projection
L = close
N = no_clip
R = region
S = style
U = timestamp
V = verbose
W = pen
X = xshift
Y = yshift
Z = zvalue
a = aspatial
b = binary
c = panel
d = nodata
e = find
f = coltypes
g = gap
h = header
i = incols
l = label
p = perspective
t = transparency
w = wrap
- Parameters
data (str or numpy.ndarray or pandas.DataFrame or xarray.Dataset or geopandas.GeoDataFrame) – Pass in either a file name to an ASCII data table, a 2D
numpy.ndarray, apandas.DataFrame, anxarray.Datasetmade up of 1Dxarray.DataArraydata variables, or ageopandas.GeoDataFramecontaining the tabular data. Use parameterincolsto choose which columns are x, y, color, and size, respectively.x/y (float or 1d arrays) – The x and y coordinates, or arrays of x and y coordinates of the data points
size (1d array) – The size of the data points in units specified using
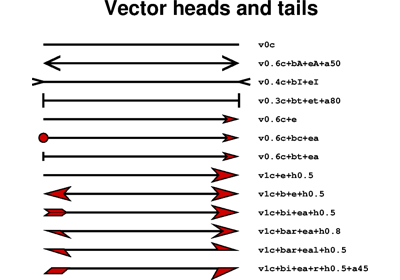
style. Only valid if usingx/y.direction (list of two 1d arrays) – If plotting vectors (using
style='V'orstyle='v'), then should be a list of two 1d arrays with the vector directions. These can be angle and length, azimuth and length, or x and y components, depending on the style options chosen.projection (str) – projcode[projparams/]width. Select map projection.
region (str or list) – xmin/xmax/ymin/ymax[+r][+uunit]. Specify the region of interest.
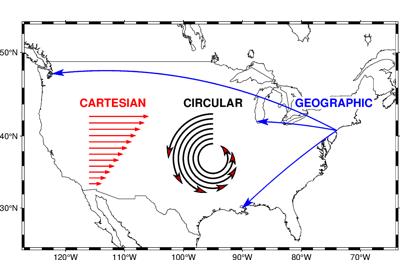
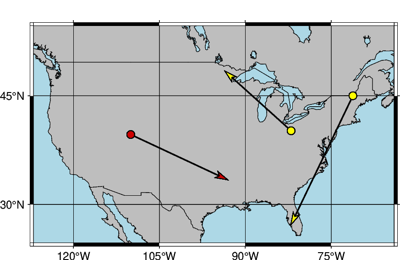
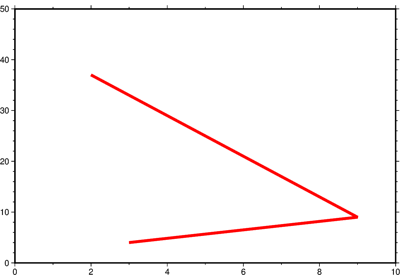
straight_line (bool or str) – [m|p|x|y]. By default, geographic line segments are drawn as great circle arcs. To draw them as straight lines, use
straight_line. Alternatively, add m to draw the line by first following a meridian, then a parallel. Or append p to start following a parallel, then a meridian. (This can be practical to draw a line along parallels, for example). For Cartesian data, points are simply connected, unless you append x or y to draw stair-case curves that whose first move is along x or y, respectively.frame (bool or str or list) – Set map boundary frame and axes attributes.
cmap (str) – File name of a CPT file or a series of comma-separated colors (e.g., color1,color2,color3) to build a linear continuous CPT from those colors automatically.
offset (str) – dx/dy. Offset the plot symbol or line locations by the given amounts dx/dy [Default is no offset]. If dy is not given it is set equal to dx.
error_bar (bool or str) – [+b|d|D][+xl|r|x0][+yl|r|y0][+ppen]. Draw symmetrical error bars. Full documentation is at https://docs.generic-mapping-tools.org/latest/plot.html#e.
connection (str) –
[c|n|r][a|f|s|r|refpoint]. Alter the way points are connected (by specifying a scheme) and data are grouped (by specifying a method). Append one of three line connection schemes:
c : Draw continuous line segments for each group [Default].
r : Draw line segments from a reference point reset for each group.
n : Draw networks of line segments between all points in each group.
Optionally, append the one of four segmentation methods to define the group:
a : Ignore all segment headers, i.e., let all points belong to a single group, and set group reference point to the very first point of the first file.
f : Consider all data in each file to be a single separate group and reset the group reference point to the first point of each group.
s : Segment headers are honored so each segment is a group; the group reference point is reset to the first point of each incoming segment [Default].
r : Same as s, but the group reference point is reset after each record to the previous point (this method is only available with the
connection='r'scheme).
Instead of the codes a|f|s|r you may append the coordinates of a refpoint which will serve as a fixed external reference point for all groups.
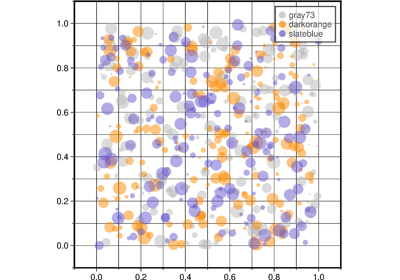
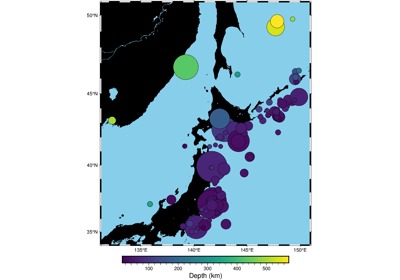
color (str or 1d array) – Select color or pattern for filling of symbols or polygons. Default is no fill. color can be a 1d array, but it is only valid if using
x/yandcmap=Trueis also required.intensity (float or bool or 1d array) – Provide an intensity value (nominally in the -1 to +1 range) to modulate the fill color by simulating illumination. If using
intensity=True, we will instead read intensity from the first data column after the symbol parameters (if given). intensity can also be a 1d array to set varying intensity for symbols, but it is only valid forx/ypairs.close (str) – [+b|d|D][+xl|r|x0][+yl|r|y0][+ppen]. Force closed polygons. Full documentation is at https://docs.generic-mapping-tools.org/latest/plot.html#l.
no_clip (bool or str) – [c|r]. Do NOT clip symbols that fall outside map border [Default plots points whose coordinates are strictly inside the map border only]. The parameter does not apply to lines and polygons which are always clipped to the map region. For periodic (360-longitude) maps we must plot all symbols twice in case they are clipped by the repeating boundary.
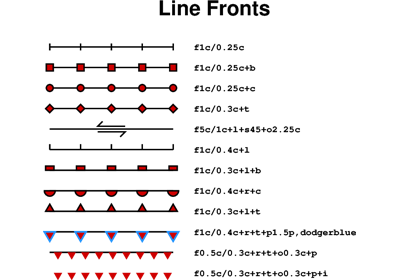
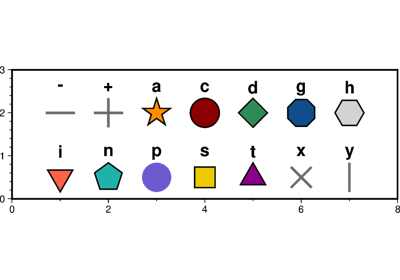
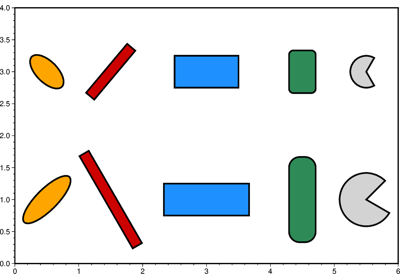
no_clip=Truewill turn off clipping and not plot repeating symbols. Useno_clip="r"to turn off clipping but retain the plotting of such repeating symbols, or useno_clip="c"to retain clipping but turn off plotting of repeating symbols.style (str) – Plot symbols (including vectors, pie slices, fronts, decorated or quoted lines).
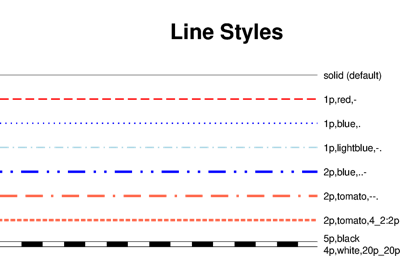
pen (str) – Set pen attributes for lines or the outline of symbols.
Select verbosity level [Default is w], which modulates the messages written to stderr. Choose among 7 levels of verbosity:
q - Quiet, not even fatal error messages are produced
e - Error messages only
w - Warnings [Default]
t - Timings (report runtimes for time-intensive algorithms);
i - Informational messages (same as
verbose=True)c - Compatibility warnings
d - Debugging messages
xshift (str) – [a|c|f|r][xshift]. Shift plot origin in x-direction.
yshift (str) – [a|c|f|r][yshift]. Shift plot origin in y-direction. Full documentation is at https://docs.generic-mapping-tools.org/latest/gmt.html#xy-full.
zvalue (str) – value|file. Instead of specifying a symbol or polygon fill and outline color via
colorandpen, give both a value viazvalueand a color lookup table viacmap. Alternatively, give the name of a file with one z-value (read from the last column) for each polygon in the input data. To apply it to the fill color, usecolor='+z'. To apply it to the pen color, append +z topen.aspatial (bool or str) – [col=]name[,…]. Control how aspatial data are handled during input and output. Full documentation is at https://docs.generic-mapping-tools.org/latest/gmt.html#aspatial-full.
i|o[ncols][type][w][+l|b]. Select native binary input (using
binary="i") or output (usingbinary="o"), where ncols is the number of data columns of type, which must be one of:c - int8_t (1-byte signed char)
u - uint8_t (1-byte unsigned char)
h - int16_t (2-byte signed int)
H - uint16_t (2-byte unsigned int)
i - int32_t (4-byte signed int)
I - uint32_t (4-byte unsigned int)
l - int64_t (8-byte signed int)
L - uint64_t (8-byte unsigned int)
f - 4-byte single-precision float
d - 8-byte double-precision float
x - use to skip ncols anywhere in the record
For records with mixed types, append additional comma-separated combinations of ncols type (no space). The following modifiers are supported:
w after any item to force byte-swapping.
+l|b to indicate that the entire data file should be read as little- or big-endian, respectively.
Full documentation is at https://docs.generic-mapping-tools.org/latest/gmt.html#bi-full.
panel (bool or int or list) – [row,col|index]. Select a specific subplot panel. Only allowed when in subplot mode. Use
panel=Trueto advance to the next panel in the selected order. Instead of row,col you may also give a scalar value index which depends on the order you set viaautolabelwhen the subplot was defined. Note: row, col, and index all start at 0.nodata (str) – i|onodata. Substitute specific values with NaN (for tabular data). For example,
d="-9999"will replace all values equal to -9999 with NaN during input and all NaN values with -9999 during output. Prepend i to the nodata value for input columns only. Prepend o to the nodata value for output columns only.find (str) – [~]“pattern” | [~]/regexp/[i]. Only pass records that match the given pattern or regular expressions [Default processes all records]. Prepend ~ to the pattern or regexp to instead only pass data expressions that do not match the pattern. Append i for case insensitive matching. This does not apply to headers or segment headers.
coltypes (str) – [i|o]colinfo. Specify data types of input and/or output columns (time or geographical data). Full documentation is at https://docs.generic-mapping-tools.org/latest/gmt.html#f-full.
x|y|z|d|X|Y|Dgap[u][+a][+ccol][+n|p]. Examine the spacing between consecutive data points in order to impose breaks in the line. To specify multiple criteria, provide a list with each item containing a string describing one set of criteria.
x|X - define a gap when there is a large enough change in the x coordinates (upper case to use projected coordinates).
y|Y - define a gap when there is a large enough change in the y coordinates (upper case to use projected coordinates).
d|D - define a gap when there is a large enough distance between coordinates (upper case to use projected coordinates).
z - define a gap when there is a large enough change in the z data. Use +ccol to change the z data column [Default col is 2 (i.e., 3rd column)].
A unit u may be appended to the specified gap:
For geographic data (x|y|d), the unit may be arc d(egree), m(inute), and s(econd), or (m)e(ter), f(eet), k(ilometer), M(iles), or n(autical miles) [Default is (m)e(ter)].
For projected data (X|Y|D), the unit may be i(nch), c(entimeter), or p(oint).
Append modifier +a to specify that all the criteria must be met [default imposes breaks if any one criterion is met].
One of the following modifiers can be appended:
+n - specify that the previous value minus the current column value must exceed gap for a break to be imposed.
+p - specify that the current value minus the previous value must exceed gap for a break to be imposed.
header (str) –
[i|o][n][+c][+d][+msegheader][+rremark][+ttitle]. Specify that input and/or output file(s) have n header records [Default is 0]. Prepend i if only the primary input should have header records. Prepend o to control the writing of header records, with the following modifiers supported:
+d to remove existing header records.
+c to add a header comment with column names to the output [Default is no column names].
+m to add a segment header segheader to the output after the header block [Default is no segment header].
+r to add a remark comment to the output [Default is no comment]. The remark string may contain \n to indicate line-breaks.
+t to add a title comment to the output [Default is no title]. The title string may contain \n to indicate line-breaks.
Blank lines and lines starting with # are always skipped.
incols (str or 1d array) –
Specify data columns for primary input in arbitrary order. Columns can be repeated and columns not listed will be skipped [Default reads all columns in order, starting with the first (i.e., column 0)].
For 1d array: specify individual columns in input order (e.g.,
incols=[1,0]for the 2nd column followed by the 1st column).For
str: specify individual columns or column ranges in the format start[:inc]:stop, where inc defaults to 1 if not specified, with columns and/or column ranges separated by commas (e.g.,incols="0:2,4+l"to input the first three columns followed by the log-transformed 5th column). To read from a given column until the end of the record, leave off stop when specifying the column range. To read trailing text, add the column t. Append the word number to t to ingest only a single word from the trailing text. Instead of specifying columns, useincols="n"to simply read numerical input and skip trailing text. Optionally, append one of the following modifiers to any column or column range to transform the input columns:+l to take the log10 of the input values.
+d to divide the input values by the factor divisor [Default is 1].
+s to multiple the input values by the factor scale [Default is 1].
+o to add the given offset to the input values [Default is 0].
label (str) – Add a legend entry for the symbol or line being plotted. Full documentation is at https://docs.generic-mapping-tools.org/latest/gmt.html#l-full.
perspective (list or str) – [x|y|z]azim[/elev[/zlevel]][+wlon0/lat0[/z0]][+vx0/y0]. Select perspective view and set the azimuth and elevation angle of the viewpoint. Default is [180, 90]. Full documentation is at https://docs.generic-mapping-tools.org/latest/gmt.html#perspective-full.
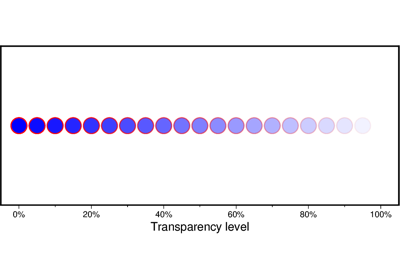
transparency (int or float) – Set transparency level, in [0-100] percent range. Default is 0, i.e., opaque. Only visible when PDF or raster format output is selected. Only the PNG format selection adds a transparency layer in the image (for further processing). transparency can also be a 1d array to set varying transparency for symbols, but this option is only valid if using x/y.
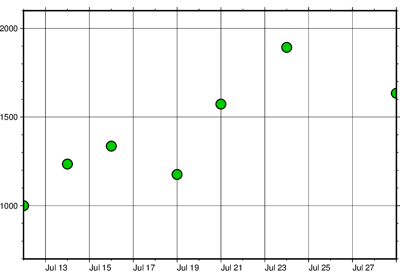
wrap (str) –
y|a|w|d|h|m|s|cperiod[/phase][+ccol]. Convert the input x-coordinate to a cyclical coordinate, or a different column if selected via +ccol. The following cyclical coordinate transformations are supported:
y - yearly cycle (normalized)
a - annual cycle (monthly)
w - weekly cycle (day)
d - daily cycle (hour)
h - hourly cycle (minute)
m - minute cycle (second)
s - second cycle (second)
c - custom cycle (normalized)
Full documentation is at https://docs.generic-mapping-tools.org/latest/gmt.html#w-full.